# Application Insights Dashboard
The Developer Center has been equipped with a robust reporting structure in the Dashbard module that allows developers to automatically track all merchant statistics, analyzing app behavior and performance on a monthly and yearly basis. Each section of the dashboard covers a specific peformance item that is crucial for the evaluation of the app's success in the App Center.
The dashboard metrics are enabled automatically after the first application is published in the App Center and it will follow the performance of the organization month by month.
TIP
Each section of the Dashboard contains a tooltip with useful information to understand the presented metrics.
# Overview
The overview section can be found at the top of the dashboard and covers the general performance of the organization based on the published applications. The data presented in this section corresponds to the results of the previous month and it is updated on a monthly basis based on the established billing cycles.
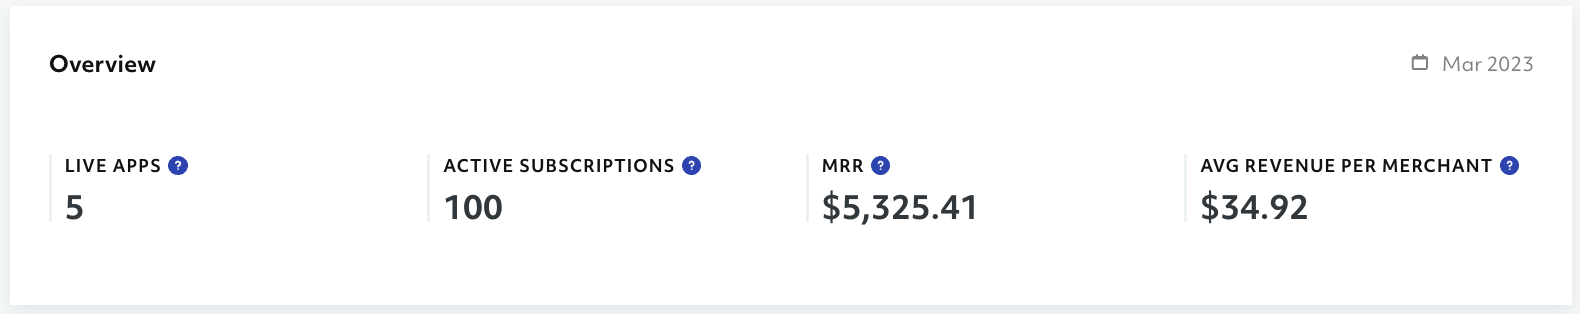
Live Apps: This component represents the amount of applications that have been reviewed, approved and published to the App Center. The applications that have been published previously but have been removed from the app center are not taken into account.
Active Subscriptions: This component details the total number of active subscriptions for all the live applications summed together.
MRR: MRR stands for Monthly Recurring Revenue and represents the total amount that the organization received on the previous month for the active subscriptions.
Avg. Revenue Per Merchant: This component shows in average how much revenue a single merchant generates for the organization, from one or multiple subscriptions.
# Recurring Revenue Trend
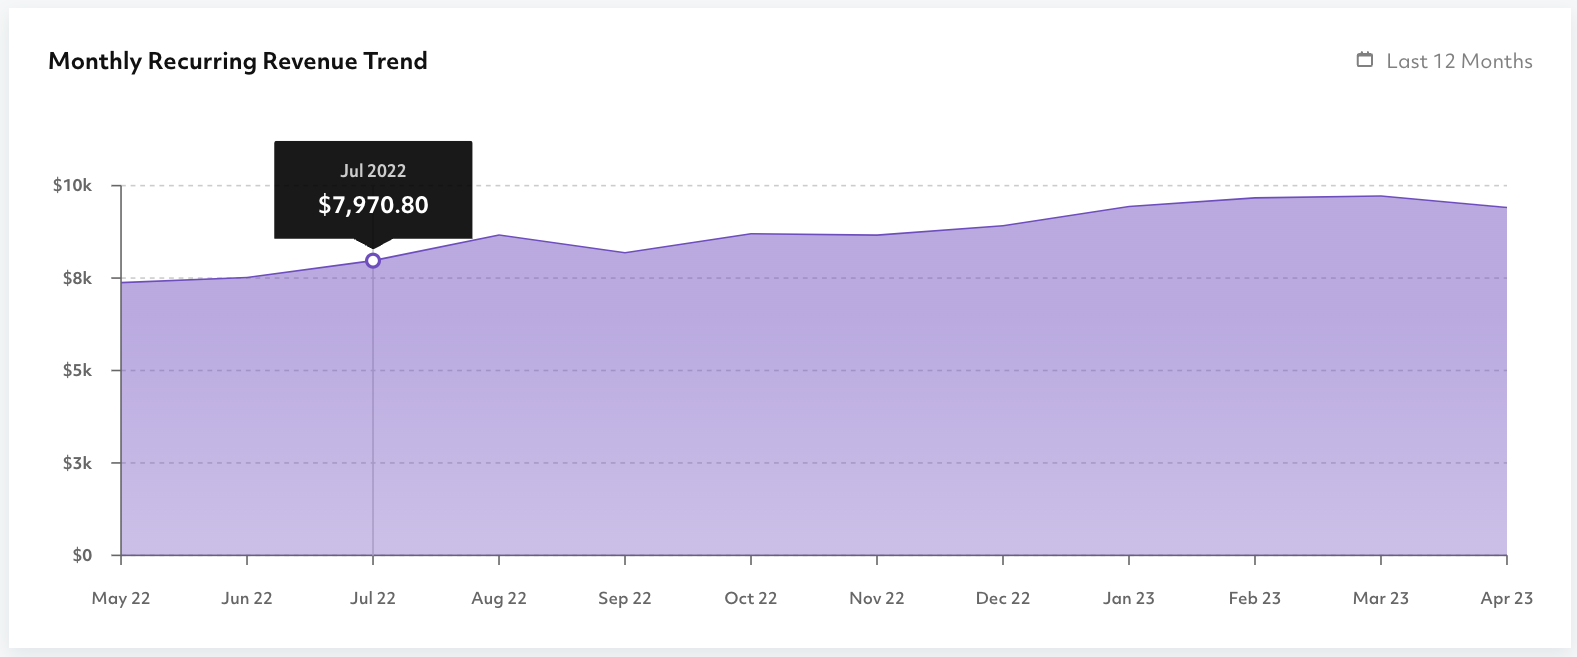
Found at the top of the dashboard, the Monthly Recurring Revenue Trend compares the total amount received by organization during the past 12 months, providing a visual representation of the revenue fluctuation observed every month.
The amounts presented for each month correspond to the total revenue of all the live applications summed together. This tool is ideal to establish revenue goals and faciliate accounting.
# App Revenue Breakdown
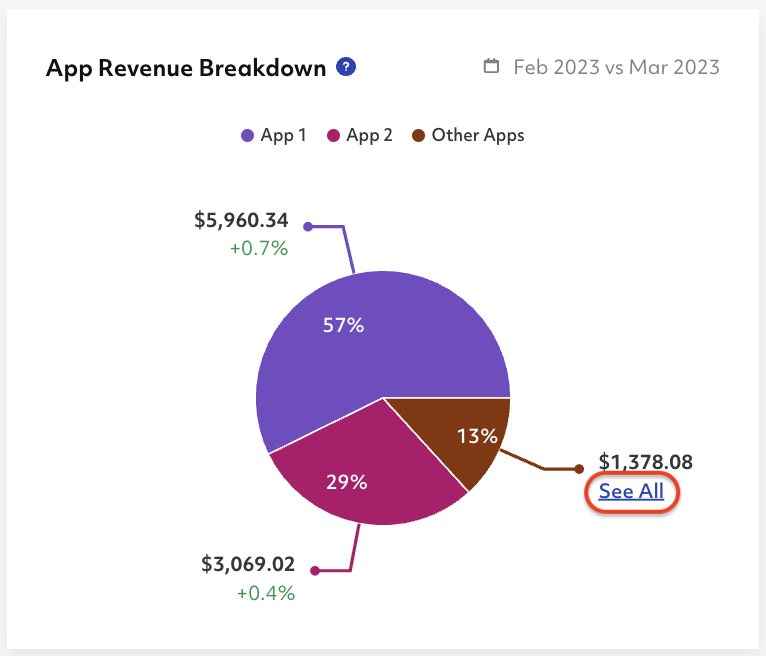
The App Revenue Breakdown compares the revenue amounts generated by each of the live applications in the 2 previous months. In most cases, the graphic will contain the percentage of the two most profitable applications and the percetange for the other applications altogether.
You can access a more detailed list of percetages and revenue by clicking See All right below the amount for Other Apps (see image below.)
# Total Subscriptions
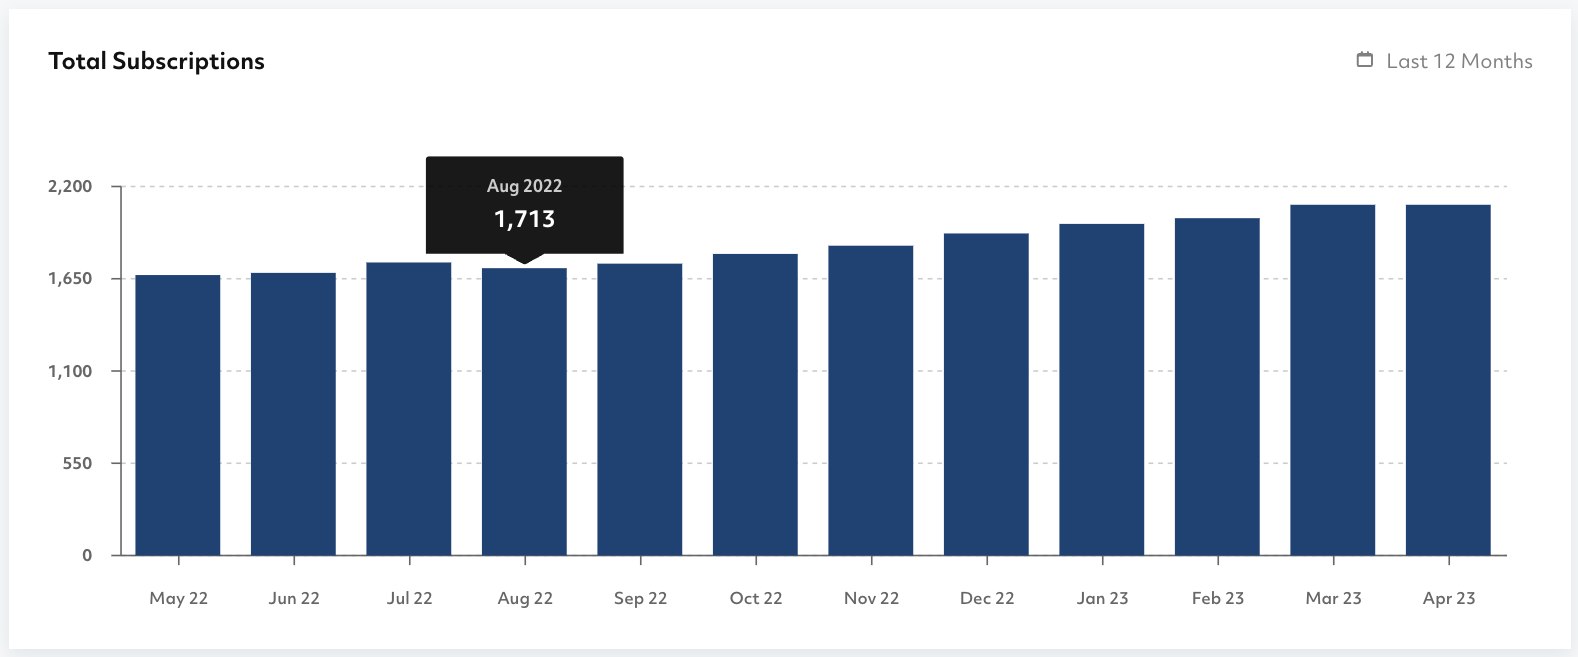
This graphic shows the total number of active subscriptions reported each month for the past 12 months. This number contains the subscriptions of all the live applications.
In cases where a single merchant is subscribed to two or more applications developed by the same organization, this graph will include the total number of subscriptions.
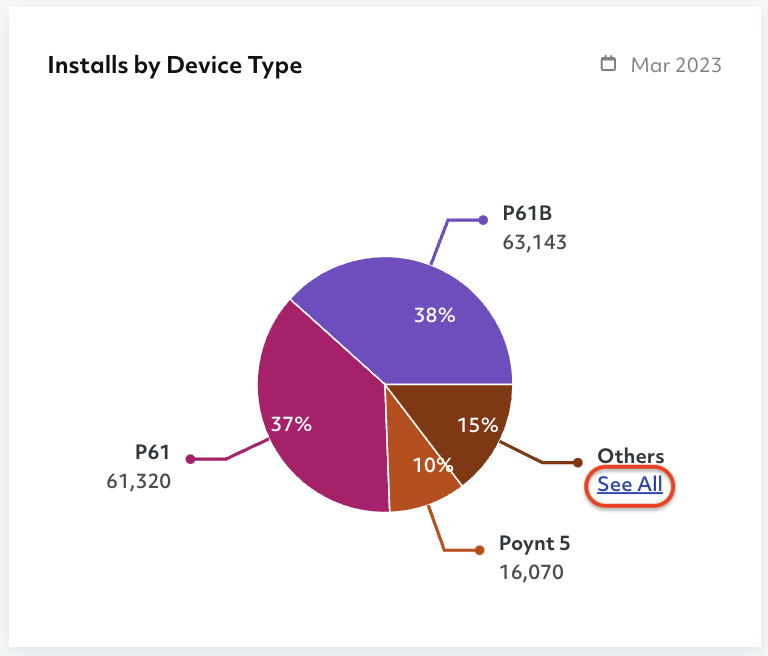
# Installs by Device
This section tracks the amount of application installs in the previous month based on the specific GoDaddy Poynt device that the merchant is using at the moment of installation. This graphic is ideal to create UX/UI developent strategies and target your application enhancements accordingly while maintaing consistency throughout devices.
You can also click See All to access a detailed list of device installs and their percentage in the app's general installation metrics.
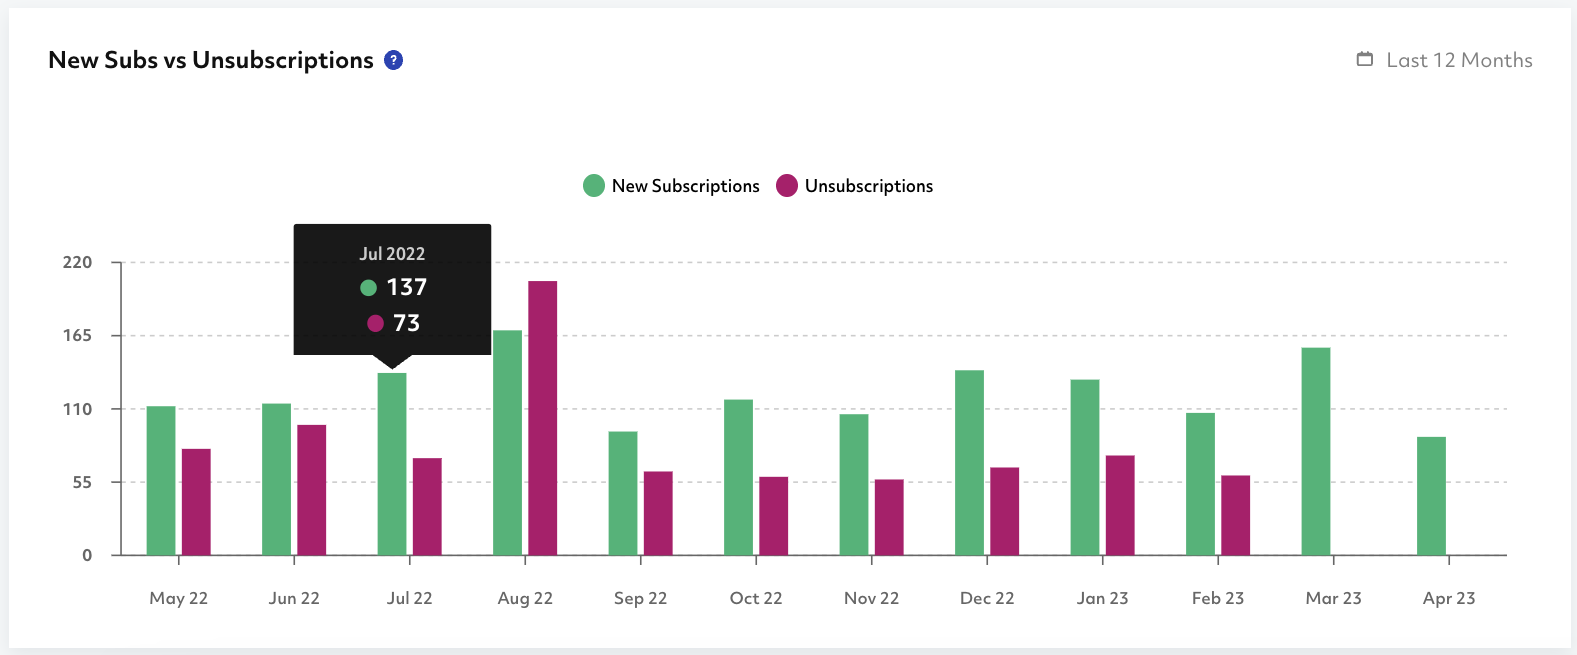
# New Subscriptions vs. Unsubscriptions
This section of the dashboard compares the amount of new subscriptions with the amount of unsubscriptions reported each month for the last 12 months.
NOTE
You may notice a spike in unsubscriptions at the beginning of each month. This is due to the automatic unsubscription for merchants that have not updated their payment method.
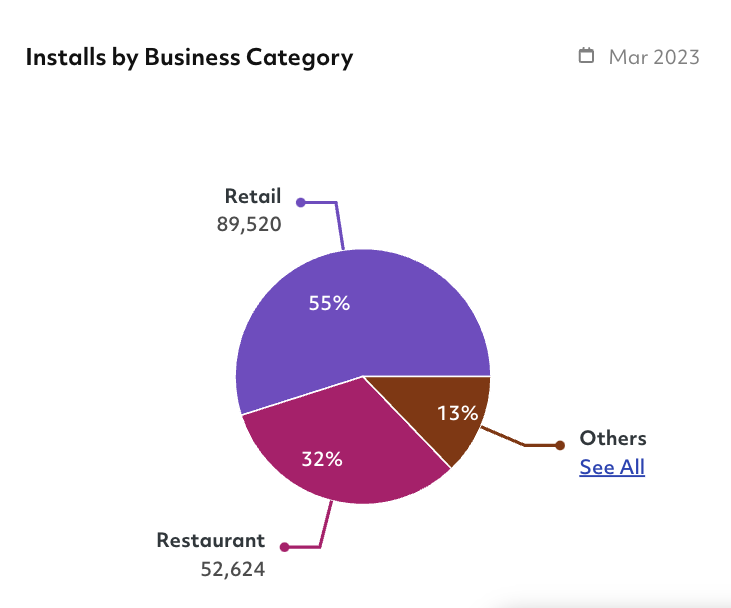
# Installs by Business Category
This section can be found at the bottom right corner of the Dashboard module and shows the percentage of installs based on specific business verticals such as Retail, Restaurant, Supermaket, Salons, Spas, among others. This information can be very helpful to integrate app enhancements and functionalities for different business verticals.
You can also click See All to access a detailed list of business vertical installs and their percentage in the app's general installation metrics.
# Individual Performance Summary
The Developer Center is also equipped with an individual performance summary detailing the overall performance of each individual application. This section can be found at the top of the OVERVIEW tab within any application you select.
TIP
The performance summary of the app overview will be enabled once your application is live on the App Center.
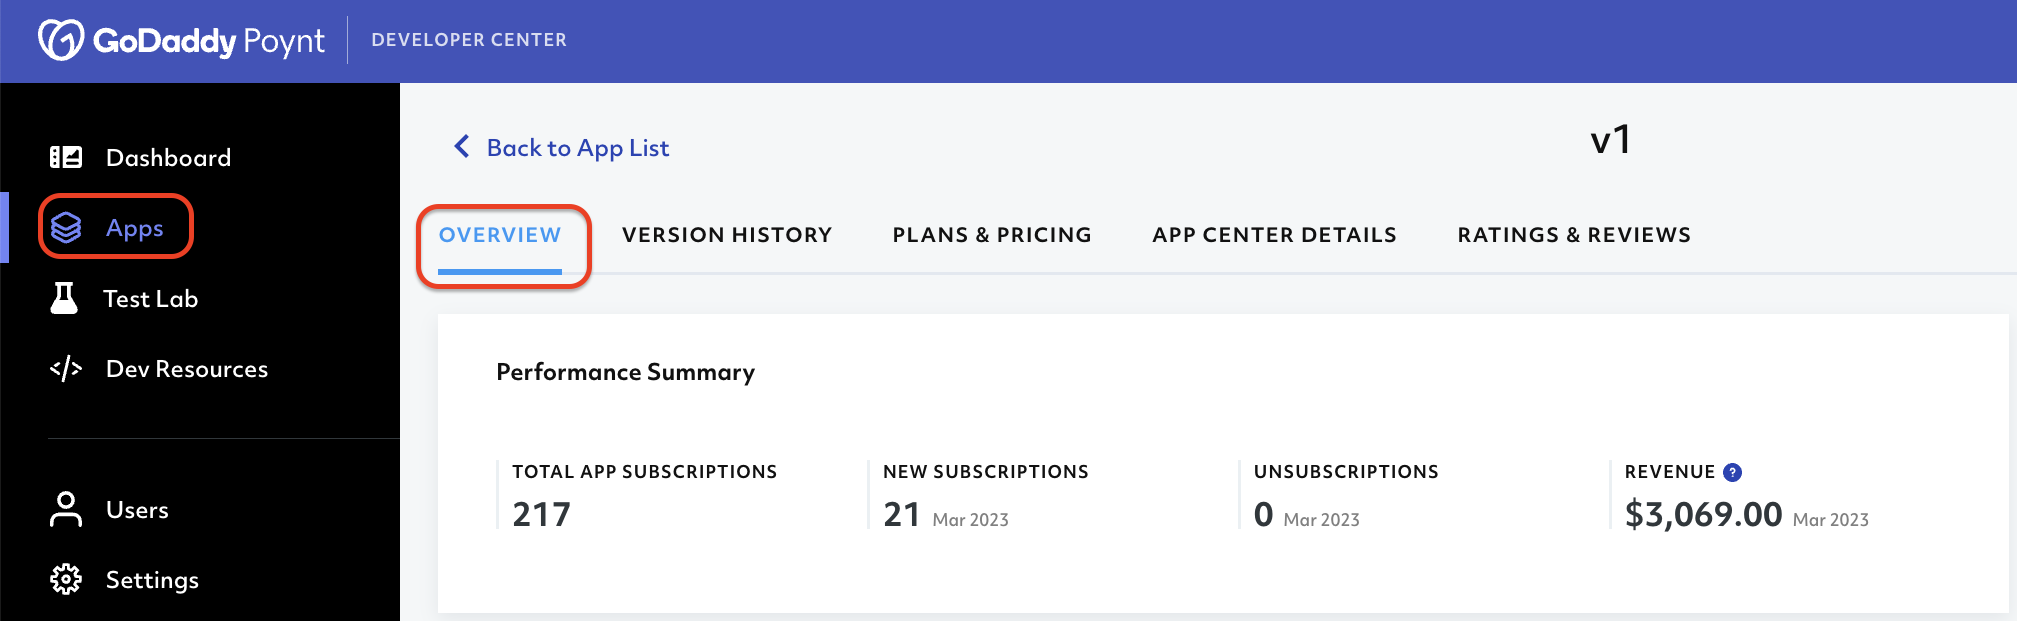
This section is integrated by the components outlined below:
Total App Subscriptions: This component details the total number of active subscriptions that the application has at the moment.
New Subscriptions: Here, the performance summary details the total number of new subscriptions that were reported in the previous month.
Unsubcriptions: Here, you can see the total number of merchants that unsubscribed from the application in the previous month.
Revenue: This component shows the total amount generated by the subscriptions of the application during the previous month.